Comparing SFS_CODE to Coalescent and Poisson Random Field Expectations
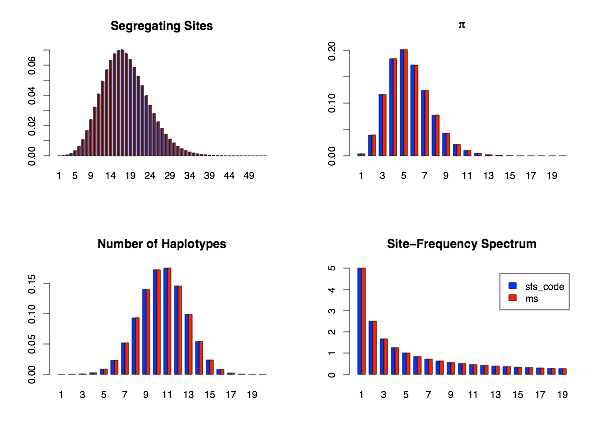
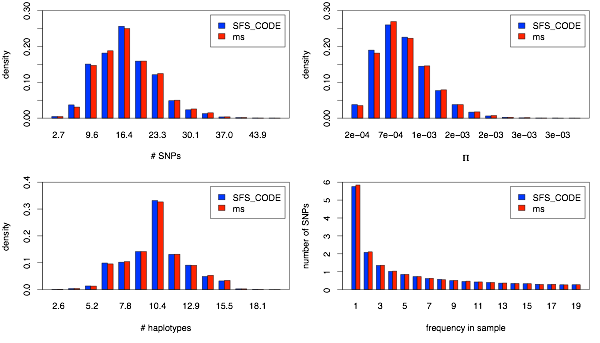
This is the simplest possible simulation to perform. First I show the distribution of the 4 statistics mentioned above for the case of no recombination (i.e., ρ = 0). Other than a slight amount of stochasticity (due to only generating 15,000 simulations), the distributions generated by SFS_CODE and ms are identical for all statistics evaluated.
7/25/08
When possible, neutral models of evolution are tested by comparing patterns of variation generated by SFS_CODE to those obtained using Dick Hudson’s coalescent simulator ms under equivalent parameters. When testing the dynamics for a single population, I will focus on the following statistics:
-
1.The number of SNPs
-
2.Nucleotide diversity per site (π)
-
3.The number of haplotypes
-
4.Site-frequency spectrum
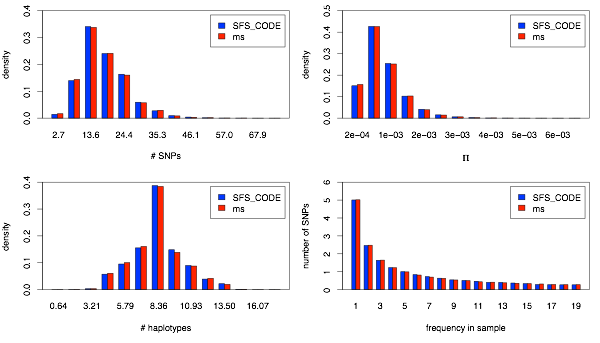
The distribution of these statistics across simulations provide evidence that the mutation and recombination processes are working as intended. For all comparisons, I have generated 15,000 simulated data sets from both SFS_CODE and ms. Each data set corresponds to a sample 20 chromosomes (10 diploid individuals in the case of SFS_CODE) across a 5kb sequence, with mutation (θ=4Neμ) and recombination (ρ=4Ner) both set to 0.001/site in the ancestral population (unless otherwise noted).
Neutral Models: 1 population
-
1.stationary POPULATION SIZE
-
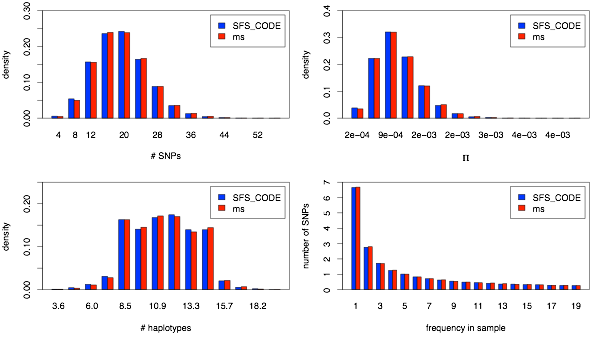
2.instantaneous Population growth
-
3.Population bottleneck
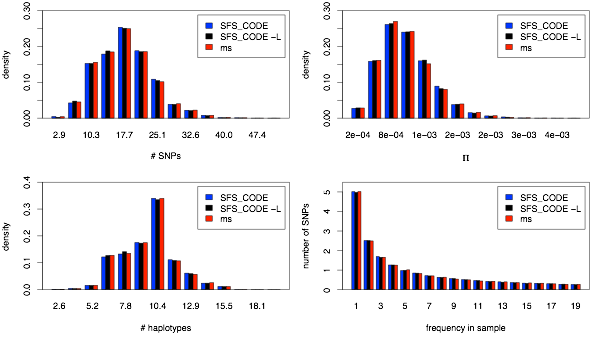
Next I show the case of ρ = θ = 0.001/site. I’ve also included a second set of simulations from SFS_CODE (identified with “-L”) that correspond to assuming that the 5kb locus was simulated assuming that there were 5 adjacent loci each of length 1kb. The same amount of sequence, just simulated differently. As expected, there is no difference.
In this example, I assume an instantaneous 2-fold population expansion that took place 0.1×2NA generations ago. The following lines show the commands used to generate the SFS_CODE and ms simulations:
sfs_code 1 15000 -A -a N -n 10 -r 0.001 -Td 0 2 -TE 0.1
ms 20 15000 -t 10 -r 10 5000 -eN .025 .5
This single population comparison involves a simple 2-epoch bottleneck model. The parameters correspond to the inferred demographic history of a sample of European Americans from Boyko, et al., 2008. The following lines show the commands used to generate the SFS_CODE and ms simulations:
sfs_code 1 15000 -A -a N -n 10 -r 0.001 -Td 0 0.722 -Td 0.48 5.27 -TE 0.54
ms 20 15000 -t 19.2 -r 19.2 5000 -eN .00728 0.19 -eN 0.0714 0.263
-
4.Crossing-over and Gene conversion
I finish off the single population comparisons with a demonstration that the parameters used in the gene conversion model can easily be converted to the parameters used by ms (see documentation for a more detailed description). The command line arguments used are shown below. It should be noted that these simulations were performed on a modified version of sfs_code in which the total gene conversion tract (the sum of both nucleotide excisions surrounding a double stranded break) was drawn from a single geometric distribution with the indicated mean. The released version of sfs_code draws the lengths of the two excision tracts independently from a geometric distribution such that the total conversion tract longer is no longer geometrically distributed (in which case it may not reproduce the ms simulations exactly). Note that the difference in mean tract lengths is due to truncation in sfs_code at the end of the simulated sequence, and is explained in the documentation.
sfs_code 1 1000000 -A -n 10 -r 0.003 -H 0.333 250
ms 20 1000000 -t 5 -r 5 5000 -c 2 237