Comparing SFS_CODE to Coalescent and Poisson Random Field Expectations
7/24/08
No forward population genetic simulation program would be complete without natural selection. To test whether SFS_CODE is properly generating data under the specified model of natural selection, I will compare the normalized site-frequency spectrum produced by SFS_CODE to their expected values under Poisson Random Field theory (e.g., Boyko, et al., 2008). The Poisson Random Field (PRF) model implicitly assumes independence among sites (i.e., free recombination). Since SFS_CODE does not accommodate this assumption, I will generally assume that the recombination rate per site is 10×mutation rate. Though this is by no means independent, it generally breaks linkage down sufficiently (except in the case of positive selection, described below). Both a constant population size as well as a population that has recently expanded will be evaluated. Many thanks to Adam Boyko for generating the PRF expectations using his program prfreq. SFS_CODE simulations were performed assuming a sequence of length 5kb.
Natural Selection
-
1.Constant population size
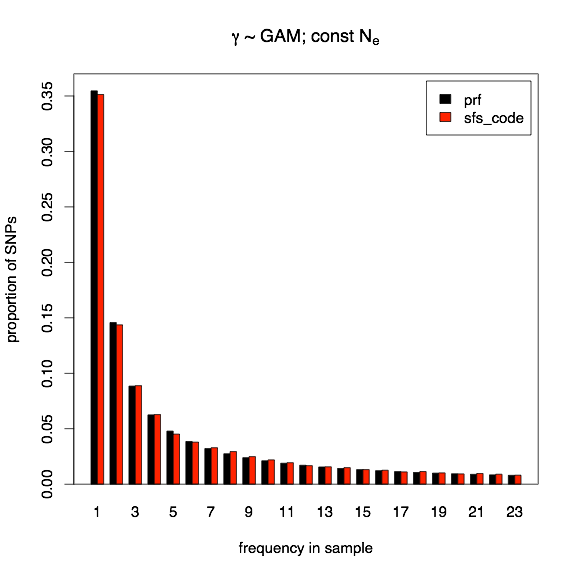
Two models of natural selection will be considered for a population of constant size: (1) all mutations have a selection coefficient of γ = 2Ns = 5 (which represents a model of rampant positive selection), and (2) each mutation has an independent selection coefficient drawn from a -Gamma(0.184, 0.000122) distribution (negative sign indicating that the values are flipped across the y-axis to represent negative selection, with parameters inferred by Boyko, et al., 2008).
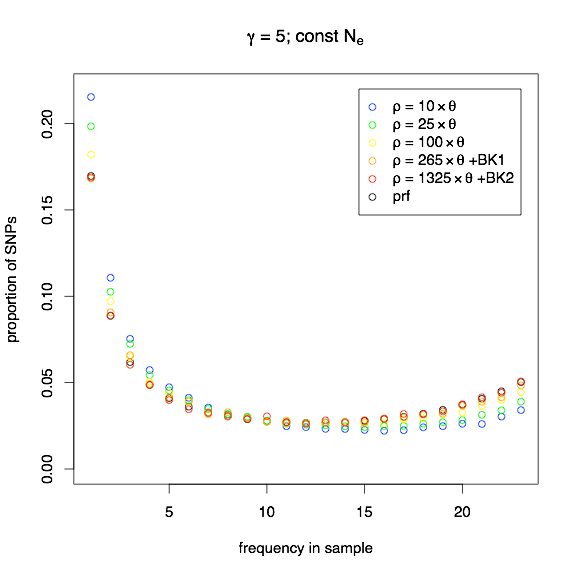
The first example (γ = 5 for all mutations) was chosen to be an extreme example of where theory can be far, far away from what might be observed. In the following figure, I show in black the normalized site-frequency spectrum (SFS) expected under the Poisson Random Field (PRF) model, and in blue, green, yellow, orange, and red, I show SFS_CODE simulations with higher and higher recombination rates (BRK1 indicates subdividing the simulated sequence into 10 equal segments with 100kb spacing, and BRK2 indicates simulating 20 equal segments with 100kb). As you can see, even when ρ= 10×θ, the observed SFS can be quite different from the expected SFS under the PRF assumption of independence. Only in the most extreme cases of recombination do the simulations approach the PRF expectation.
-
2.Population growth
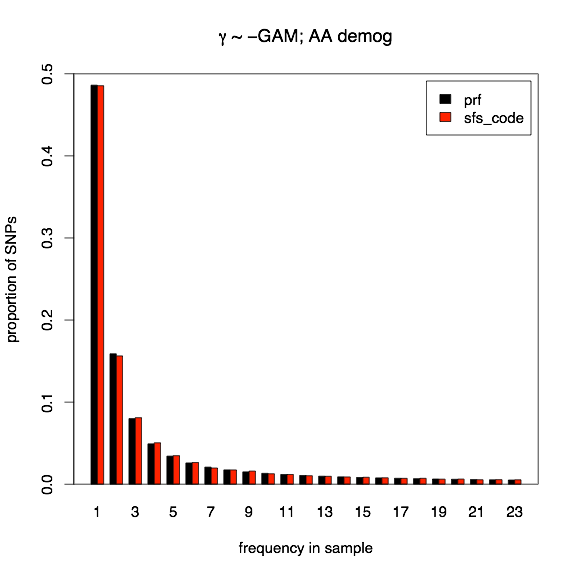
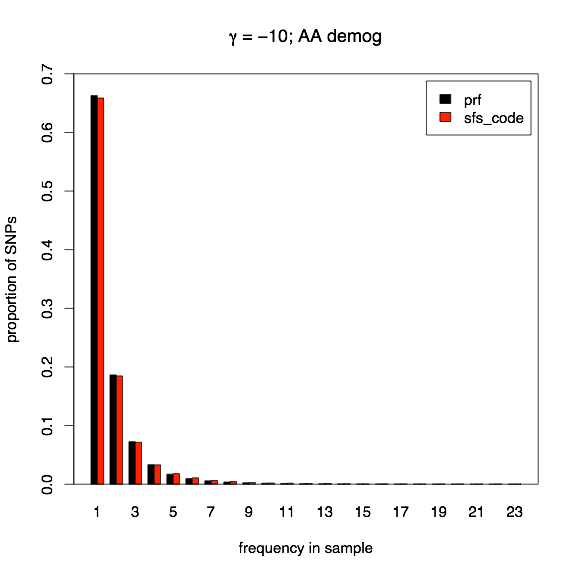
The model of population growth evaluated here corresponds to the demographic history inferred for African Americans in Boyko, et al., 2008, and corresponds to a 3.3-fold expansion 0.44×2N generations ago. The two models of selection that I will consider here are both models of deleterious effects. First, all mutations will have a constant selection coefficient of γ = -10 in the current population (-3.03 in the ancestral population), and second, all mutations have an independent selection coefficient drawn from the same Gamma distribution described above (correcting for the change in population size, of course). Again, red bars indicate SFS_CODE, and black bars indicate PRF expectations.
Next I show the normalized site-frequency spectrum for the case of a Gamma distribution of deleterious selective effects. The black bars represent the PRF expectation, and the red bars indicate the average over 16000 SFS_CODE simulations (with a total length of 5kb and recombination rate per site is 10×mutation rate). With deleterious selective effects, most mutations do not survive long enough for linkage to be a driving issue, so a 10-fold increase in recombination is sufficient to obtain PRF expectations.