Computation Time
Simulating a 100kb Sequence
Among the main contributors to the computational cost of a forward simulation are the number of individuals (N) that are simulated (which increases both the number of generations as well as the number of computations per generation) and the length of the sequence (which determines, among other things, the number of mutation and recombination events that take place each generation).
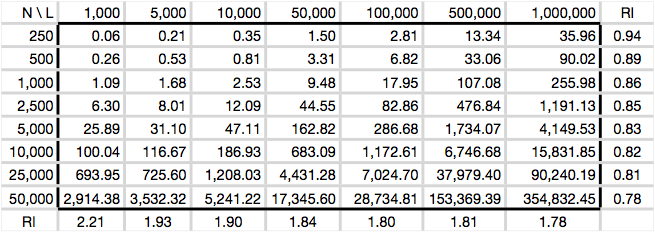
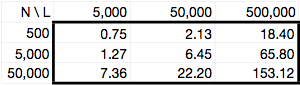
In the following table, I report the time (in seconds) for a single computation (10N generations) with a fixed θ (4Neμ) = ρ (4Ner) = 0.001/site in a population of constant size N diploid individuals (2N chromosomes) across a sequence of length L basepairs. Values within a column represent the direct impact of increasing the population size (as the number of mutation and recombination events are held fixed).
The terminal row and column (labeled RI) show the mean relative increase in time due to increasing the number of individuals and sequence length (respectively). It is calculated as AVG[(ti xi)/(ti-1 xi-1)], where ti is the time in cell entry i and xi is the size corresponding to row or column i. Notice that RI tends to decrease as you move down the column or across the row.
These computations were performed on system with dual quad-core 2.8Ghz processors running Mac OSX (v10.5).
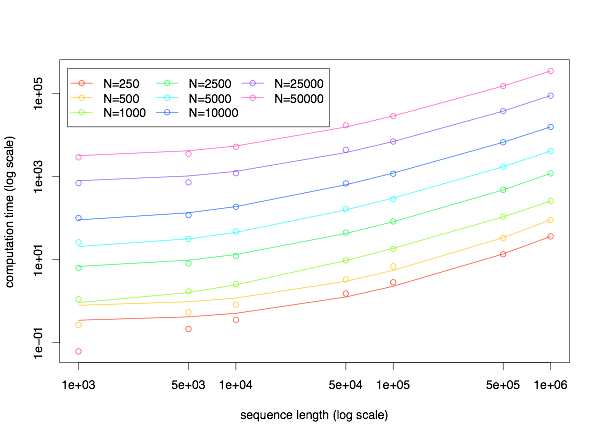
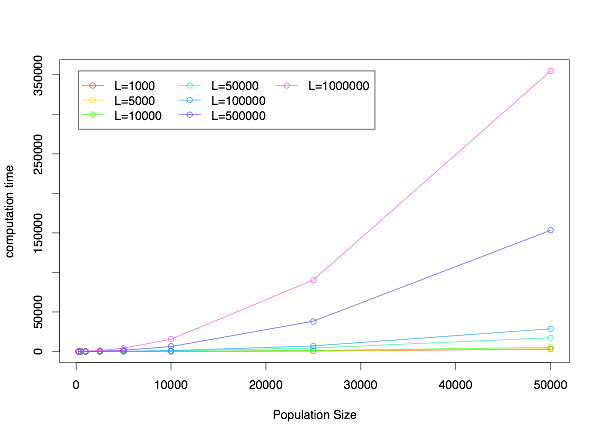
Below, you will find two plots that show the computation time (in seconds) as a function of the sequence length (for different population sizes, on top) and as a function of the population size (for different sequence lengths, on bottom). The points indicate the observed times, while the lines show the best fitting quadratic curve. This suggests that computation time may be approximated by a quadratic function of both the sequence length and population size (with different scaling coefficients, of course). Minor exceptions hold for small population sizes and sequence lengths, in which cases sfs_code is faster than expected.
In addition to being computationally fast, sfs_code also makes efficient use of memory. Below is a table showing the RAM requirements (in Mb) for various sequence lengths and population sizes. The peak memory usage for a program was obtained using a shell script (peakMem.sh) that I wrote. It is used just like the unix function time (i.e., peakMem.sh <program> <arg_1> ... <arg_n>), but returns the peak real memory usage (in kb) during the course of the indicated program.
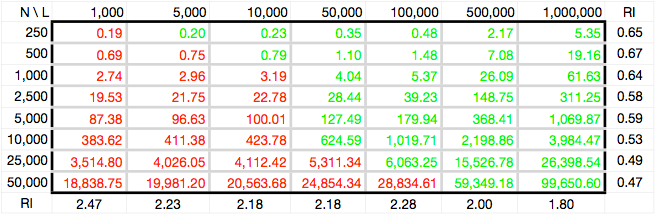
Recently, a different simulation program (forwsim) was published in Genetics. This program utilizes a novel algorithm of only applying mutation/recombination events to chromosomes that will survive some number of generations into the future. This algorithm reduces the number of computations required, and therefore allows for faster simulations. In their paper, the authors show that forwsim is faster than other publicly available forward simulation programs. To put the efficiency of sfs_code into perspective, I used forwsim to generate a table analogous to the one above (note that N refers to the number of diploid individuals). The table is shown below, with cell entries color coded to show parameter combinations that are faster than sfs_code in green and slower in red. Generally speaking, sfs_code is faster than forwsim when simulating sequences <50kb. In particular, when simulating coding regions of genes (typically just 1-2kb), sfs_code will be much faster than other programs available. Note that for the forwsim simulations, I changed u and r such that 4Nu/L and 4Nr/L remained constant at 0.001 (as was the case for the sfs_code simulations above). I also set the program to check for fixations every 20 generations, as from preliminary analysis, this value seemed to match the computation time reported in their paper on my computer.
Memory Requirements
To put the memory usage into context, I have also used peakMem.sh to generate the peak memory usage for forwsim (below). Note that all parameter combinations used more memory than sfs_code.

There are many ways to simulate a sequence. One could simply use -L <1> <length>. Alternatively, one could split the total sequence into two linked blocks using -L <2> <length/2>. More generally, an given sequence be divided into an arbitrary number of linked loci using -L <n> <length/n>. However, different number of loci and locus lengths require different amounts of time and memory to simulate. For example, consider simulating a sequence of length 100kb. If you were to simulate a single locus (-L 1 100000) with recombination, then there are potentially a large number mutation events that have to be copied to produce each recombinant gamete. This can require a lot of time. At the opposite extreme, you could consider simulating 200 linked loci each of length 500bp (-L 200 500). The problem now becomes choosing a particular locus to mutate/recombine, which can require time. The optimal simulation scheme lies somewhere in between these two extremes, as shown by the following graph. The x-axis shows the length of each locus (in kb) used to simulate the full 100kb sequence (the total number of loci differs for each point). At the left is the case of 200 linked loci of length 500bp (0.5kb, for a total sequence length 200×500=100,000). At the far right is the case of a single locus of length 100kb. In this example, sequencing 25 loci of length 4kb requires the least amount of time, and is among those with the lowest memory. The vertical axis on the left shows the average amount of time required (in seconds, across 10 iterations, corresponding to the blue curve). The vertical axis on the right shows the peak amount of memory required (in Mb) during the 10 iterations (corresponding to the red curve). The command used to generate each point is as follows:
./sfs_code 1 10 -A -L <N> <100000/N> -o out100kb_10.txt -r 0.001 -a N -b 5
